+1 (216) 400-5753
 521 Valcour Rd, Catonsville, MD 21228, US

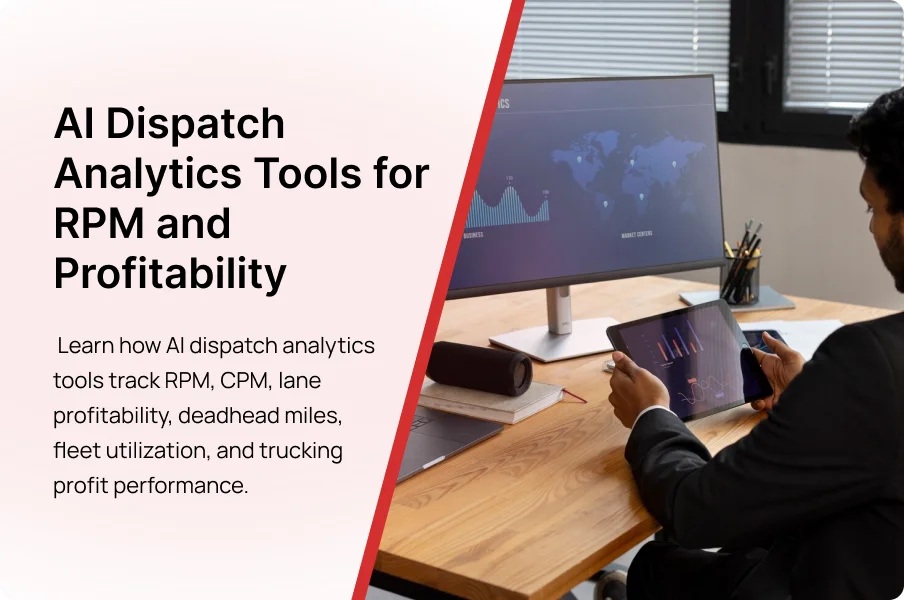
Running more loads doesn’t always mean earning more profit. Many carriers struggle to understand why strong revenue numbers fail to translate into healthy margins. Hidden costs, unprofitable lanes, excessive deadhead miles, and inefficient dispatch decisions can quietly drain profitability. That’s where AI dispatch analytics tools make a difference. By tracking RPM, profitability metrics, and real-time operational performance, these platforms help carriers turn freight data into smarter, more profitable decisions.
Understanding Dispatch Analytics in Modern Trucking
What Are Dispatch Analytics Tools?
Dispatch analytics tools are software platforms that collect, organize, analyze, and visualize operational and financial data generated during freight movements.
Rather than focusing solely on dispatch execution, these tools provide insights into performance, profitability, utilization, costs, and revenue trends.
Common data sources include:
- Transportation Management Systems (TMS)
- Electronic Logging Devices (ELDs)
- Load boards
- Fuel card systems
- Accounting platforms
- GPS tracking systems
- Fleet management software
The goal is simple: transform raw transportation data into actionable business intelligence.
How Dispatch Analytics Differs From Traditional Dispatch Software
Traditional dispatch software helps carriers manage loads, assign drivers, schedule deliveries, and maintain records.
Dispatch analytics goes much further.
Instead of asking:
“Which truck should take this load?”
Analytics asks:
“Which load will generate the highest margin?”
Traditional dispatch software focuses on operational execution.
Dispatch analytics focuses on operational optimization.
The Evolution From Dispatcher to Dispatch Analyst
The dispatcher role has changed dramatically.
Historically, dispatchers were responsible for:
- Booking freight
- Communicating with drivers
- Managing schedules
- Handling broker interactions
Today, successful dispatchers increasingly function as dispatch analysts.
They evaluate:
- Lane profitability
- Revenue trends
- Cost patterns
- Market rates
- Equipment utilization
- Carrier performance metrics
Technology has shifted dispatching from administration to strategic decision-making.
Why Analytics Has Become a Competitive Advantage
Freight markets move quickly.
Rates fluctuate daily.
Fuel prices change unexpectedly.
Capacity shortages emerge with little warning.
Companies that rely solely on experience often react after profitability problems appear.
Companies using analytics identify opportunities and risks before they impact the bottom line.
This creates a significant competitive advantage.
The Operational Challenges Driving Demand for Dispatch Analytics
Why Dispatchers Still Waste Time Switching Between Systems
A typical dispatcher may use:
- Load boards (Use one centralized dashboard to compare loads, rates, routes, and broker details quickly).
- TMS platforms (Choose an integrated TMS to manage dispatching, documents, drivers, and load status in one place).
- Broker portals (Store broker credentials and documents securely to complete setup and load booking faster).
- Email (Use organized folders, templates, and automated follow-ups to avoid missing rate confirmations or broker messages).
- Messaging apps (Keep driver and broker communication on one approved platform for clear and trackable updates).
- GPS systems (Use real-time GPS tracking to monitor drivers, plan routes, and provide accurate delivery updates).
- Accounting software (Connect dispatch and accounting tools to track invoices, payments, expenses, and outstanding balances. Adding a truck accounting services consultant to the team also helps to ensure a smooth revenue flow.
Every platform contains valuable information.
The problem is fragmentation.
Dispatchers spend countless hours switching between applications instead of making decisions.
Communication Gaps Between Load Boards, TMS, and Broker Portals
Critical information often exists in multiple locations.
A load board may show available freight.
The TMS contains operational history.
Broker portals contain payment details.
Without integration, dispatchers must manually gather information before evaluating opportunities.
This creates delays and increases error rates.
Limited Visibility Into Daily Performance
Many carriers struggle to answer questions such as:
- Which dispatcher generates the highest RPM?
- Which lane produces the strongest margins?
- Which customers generate the lowest profitability?
- Which trucks are underutilized?
Without analytics, these answers remain hidden.
The Cost of Manual Decision-Making
Manual decisions create bottlenecks.
Dispatchers may spend several minutes evaluating a single load opportunity.
Multiply that across hundreds of weekly decisions and the impact becomes substantial.
Slow decisions often result in:
- Missed opportunities
- Lower rates
- Increased deadhead miles
- Reduced productivity
Why Traditional TMS Platforms Fall Short
Transportation Management Systems are valuable operational tools.
However, most were designed primarily for:
- Documentation
- Scheduling
- Tracking
- Recordkeeping
They were not built to provide sophisticated profitability analysis or predictive decision support.
As a result, carriers increasingly supplement TMS platforms with specialized analytics solutions.
Understanding RPM and Its Role in Trucking Profitability
What Is Revenue Per Mile (RPM)?
Revenue Per Mile represents the amount of revenue generated for each mile traveled.
The calculation is straightforward:
RPM = Total Revenue ÷ Total Miles
RPM serves as one of the most important indicators of trucking performance.
RPM vs Rate Per Mile
Although often confused, RPM and rate per mile are not identical.
Rate per mile typically reflects freight pricing for a specific load.
RPM measures actual business performance across operations.
RPM provides a broader profitability perspective.
RPM vs Cost Per Mile (CPM)
RPM measures revenue generation.
CPM measures operating expenses.
Both metrics must be evaluated together.
A high RPM may still produce weak profits if costs remain excessive.
Gross RPM vs Net RPM
Gross RPM reflects total revenue before expenses.
Net RPM incorporates operational costs.
Net RPM provides a much clearer picture of profitability.
Many successful fleets prioritize net RPM when evaluating performance.
Why RPM Alone Doesn’t Define Profitability
RPM is valuable, but incomplete.
True profitability depends on:
- Fuel costs
- Maintenance expenses
- Insurance
- Driver compensation
- Deadhead mileage
- Equipment utilization
Analytics platforms combine RPM with other performance indicators to provide a complete financial picture.
The Core KPIs Every Carrier Should Track
Revenue Per Mile (RPM)
RPM remains one of the most commonly tracked trucking metrics because it reflects revenue efficiency.
Cost Per Mile (CPM)
CPM measures the total cost of operating a truck across every mile traveled.
Gross Profit Per Load
This metric evaluates the direct profit generated by individual shipments.
It helps identify high-value freight opportunities.
Net Profit Per Truck
Net profit per truck measures overall equipment profitability after expenses.
Operating Ratio
Operating ratio compares expenses to revenue.
Lower ratios typically indicate stronger financial performance.
Loaded Mile Percentage
This metric tracks the percentage of miles traveled while generating revenue.
Higher loaded-mile percentages generally improve profitability.
Deadhead Percentage
Deadhead miles represent non-revenue-generating travel.
Reducing deadhead is one of the fastest ways to improve margins.
Truck Utilization Rate
Utilization measures how effectively equipment generates revenue.
Idle trucks often represent hidden profit loss.
Revenue Per Dispatcher
This KPI measures the revenue impact generated by individual dispatchers.
Load Acceptance Rate
Load acceptance rate evaluates how effectively dispatch teams capitalize on available freight opportunities.
Hidden Revenue Leaks Dispatch Analytics Can Uncover
Excessive Deadhead Miles
Deadhead miles increase fuel consumption while generating no revenue.
Analytics tools help identify recurring deadhead patterns and opportunities for reduction.
Unprofitable Freight Lanes
Not all lanes perform equally.
Some consistently generate weaker margins despite strong revenue numbers.
Lane-level analytics reveal these hidden issues.
Low-Margin Customers
Certain customers may negotiate aggressive rates that reduce profitability.
Analytics helps carriers identify customer profitability trends.
Poor Equipment Utilization
Underutilized trucks generate less revenue while maintaining fixed operating costs.
Utilization dashboards expose these inefficiencies.
Fuel Cost Inefficiencies
Fuel represents one of the largest operational expenses.
Analytics identifies routes, drivers, and operational behaviors affecting fuel consumption.
Dispatcher Productivity Gaps
Performance differences between dispatchers often remain invisible without analytics.
Productivity reporting helps identify training opportunities and best practices.
Essential Features of Modern Dispatch Analytics Platforms
Real-Time Dispatch Dashboards
Real-time dashboards serve as the command center of modern dispatch operations.
Instead of digging through spreadsheets or multiple software systems, dispatchers can view critical metrics from a single interface.
Common dashboard insights include:
- Active loads
- Fleet status
- RPM trends
- Driver availability
- Revenue performance
- Dispatch productivity
- Lane profitability
When information becomes visible in real time, decision-making becomes significantly faster.
Revenue and Profitability Reporting
Revenue reporting shows how much money is being generated.
Profitability reporting shows how much money is actually being retained.
The difference matters.
Strong dispatch analytics platforms provide reports for:
- Profit per load
- Profit per lane
- Profit per customer
- Profit per truck
- Profit per dispatcher
This level of visibility allows carriers to prioritize opportunities that generate sustainable margins.
Cost-Per-Mile Tracking
CPM tracking provides a clear understanding of operational expenses.
Analytics platforms often categorize costs into:
- Fuel
- Maintenance
- Insurance
- Driver wages
- Tolls
- Permits
- Administrative expenses
Understanding CPM allows fleets to benchmark performance and identify cost-saving opportunities.
Lane Profitability Analytics
Lane analytics evaluates financial performance across routes.
Many dispatchers focus on rates alone.
Successful carriers focus on margins.
A lane paying $3.20 per mile may be less profitable than one paying $2.80 per mile if operational costs are significantly higher.
Lane profitability analytics reveals these hidden realities.
Fleet Utilization Monitoring
Fleet utilization determines how effectively assets generate revenue.
Analytics platforms measure:
- Truck utilization
- Trailer utilization
- Driver utilization
- Equipment downtime
Higher utilization generally translates into stronger profitability.
Driver Performance Analytics
Drivers directly influence operational efficiency.
Analytics can track:
- Fuel efficiency
- Safety performance
- Idle time
- Route compliance
- Delivery performance
This information supports coaching, training, and performance improvement initiatives.
Automated KPI Reporting
Manual reporting consumes valuable time.
Modern platforms automate KPI tracking and distribution.
Decision-makers receive scheduled reports without requiring additional administrative effort.
Business Intelligence Dashboards
Business intelligence tools transform raw transportation data into strategic insights.
These dashboards often include:
- Trend analysis
- Forecasting
- Comparative reporting
- Profitability analysis
- Performance benchmarking
Mobile and Cloud Accessibility
Dispatching rarely occurs from a single location. Cloud-based analytics allows managers, dispatchers, and executives to access critical data from virtually anywhere. A number of mobile tools to manage dispatching like, Dat One, Truck Stop and Truck Smarter.
Dispatch Performance Metrics That Matter Most
Dispatcher Productivity Score
Productivity scores evaluate how effectively dispatchers manage freight operations.
Measurements may include:
- Loads booked
- Revenue generated
- Response times
- Utilization performance
These metrics provide objective performance benchmarks.
Booking Speed Metrics
Freight opportunities often disappear quickly.
Booking speed measures how efficiently dispatchers evaluate and secure loads.
Faster booking often translates into higher-quality freight opportunities.
Load-to-Truck Matching Efficiency
Matching the right truck with the right load impacts profitability.
Analytics platforms evaluate:
- Capacity utilization
- Geographic alignment
- Equipment compatibility
- Revenue potential
Better matching creates stronger operational efficiency.
Dispatch Cycle Time
Dispatch cycle time measures the duration required to complete dispatch-related activities.
Reducing cycle time improves productivity and responsiveness.
Broker Response Time
Quick broker communication often influences load acquisition success.
Response time analytics help dispatchers identify communication bottlenecks.
Rate Negotiation Success Rate
Negotiation remains one of the most important dispatch skills.
Analytics platforms can evaluate:
- Average negotiated increases
- Win rates
- Revenue impact
This helps organizations identify top-performing dispatchers.
Carrier Retention Metrics
Retaining carriers is often more profitable than constantly acquiring new relationships.
Retention metrics help evaluate long-term operational effectiveness.
RPM Analytics and Lane Profitability Analysis
Identifying High-Profit Freight Lanes
Every market contains profitable and unprofitable lanes.
Analytics tools help identify:
- Strong-performing routes
- Seasonal opportunities
- Consistent margin leaders
Carriers can then allocate resources more effectively.
Revenue Per Lane Analysis
Lane-level reporting breaks down performance beyond overall fleet metrics.
Key insights include:
- Revenue generation
- Average rates
- Operational costs
- Margin percentages
This level of visibility supports strategic route planning.
Comparing RPM Across Regions
Regional freight markets vary significantly.
Comparative analytics helps carriers identify:
- Strong geographic markets
- Weak-performing regions
- Emerging opportunities
These insights guide expansion and optimization decisions.
Spot Market vs Contract Freight Analysis
Both freight types have advantages.
Analytics tools compare:
- Revenue consistency
- Margin performance
- Volatility exposure
- Long-term profitability
This helps carriers balance risk and opportunity.
Customer Profitability Evaluation
Not all customers contribute equally to profitability.
Analytics reveals:
- Revenue contribution
- Margin contribution
- Operational complexity
- Payment performance
This information supports account prioritization.
Predictive Lane Profitability Forecasting
Historical performance alone is no longer enough.
Predictive analytics combines:
- Historical trends
- Market rates
- Demand signals
- Capacity conditions
to forecast future lane profitability.
Cost-Per-Mile Analytics and Expense Visibility
Fuel Cost Analysis
Fuel frequently represents the largest variable expense in trucking.
Analytics platforms track:
- Fuel cost per mile
- Fuel efficiency trends
- Regional fuel price differences
- Driver fuel performance
These insights help reduce operational expenses.
Driver Compensation Costs
Labor costs directly impact profitability.
Analytics helps carriers evaluate:
- Compensation structures
- Productivity levels
- Revenue contribution
This supports sustainable workforce management.
Maintenance Expense Tracking
Unexpected repairs can significantly affect margins.
Maintenance analytics tracks:
- Repair frequency
- Equipment reliability
- Cost trends
- Preventive maintenance performance
Proactive maintenance generally costs less than reactive repairs.
Insurance Cost Allocation
Insurance costs continue to rise throughout the trucking industry.
Analytics platforms help allocate insurance expenses accurately across operations.
Toll and Route Expense Analysis
Route selection directly influences profitability.
Analytics identifies toll-heavy routes and alternative options that may improve margins.
Total Operating Cost Visibility
True profitability requires complete expense visibility.
Analytics platforms consolidate operational costs into a single performance view, enabling more informed business decisions.
How AI Dispatch Is Transforming Decision-Making
Why the Browser Is Becoming the New Dispatch Workspace
Most dispatch work already happens inside browsers.
Dispatchers spend time on:
- Load boards
- Broker portals
- Carrier systems
- Freight marketplaces
AI solutions increasingly integrate directly into these environments.
Rather than forcing dispatchers into new software platforms, intelligence is delivered where work already occurs.
Real-Time Data Access Without Workflow Disruption
Browser-based AI tools eliminate constant system switching.
Relevant information appears directly within existing workflows.
This reduces friction and improves productivity.
AI Recommendations vs Human Judgment
AI excels at processing data quickly.
Humans excel at understanding context.
The most effective dispatch operations combine both strengths.
AI identifies opportunities.
Humans make final decisions.
Human Oversight Remains Essential
Artificial intelligence is not replacing dispatchers.
Instead, it enhances decision-making by reducing repetitive analysis and highlighting relevant insights.
Human expertise remains critical for:
- Relationship management
- Exception handling
- Strategic decision-making
- Complex negotiations
Traditional Dispatch vs AI Dispatch (Comparison Table)
Traditional dispatch often relies on:
- Manual research
- Historical knowledge
- Spreadsheet analysis
- Reactive decisions
AI dispatch relies on:
- Real-time analytics
- Predictive recommendations
- Automated evaluations
, Fleet Efficiency, ROI Measurement, Platform Selection, Future TreProactive decision support
Real-Time Data and Context-Aware Dispatching
Live Freight Market Intelligence
Freight markets can change within hours.
A lane that was profitable this morning may become saturated by afternoon. Likewise, unexpected capacity shortages can create premium pricing opportunities.
Real-time freight intelligence allows dispatchers to monitor:
- Spot market rates
- Capacity trends
- Regional demand shifts
- Seasonal fluctuations
- Economic indicators affecting freight movement
Instead of relying on outdated reports, dispatchers can make decisions based on current market conditions.
Capacity and Demand Signals
Supply and demand remain the driving forces behind freight pricing.
Analytics platforms track:
- Available truck capacity
- Load-to-truck ratios
- Market congestion
- Regional freight volumes
When demand exceeds capacity, rates often rise. When capacity exceeds demand, pricing pressure increases.
Understanding these signals helps carriers position equipment more effectively.
Real-Time Rate Tracking
Rate tracking provides continuous visibility into freight pricing trends.
Benefits include:
- Better load selection
- Improved rate negotiations
- Stronger lane planning
- Faster opportunity identification
Real-time visibility allows dispatchers to respond before market conditions change.
Market Trend Analysis
Historical data alone cannot explain future opportunities.
Market trend analysis combines:
- Historical performance
- Current market activity
- Economic indicators
- Industry forecasts
This broader perspective supports long-term planning and profitability optimization.
Context-Based Dispatch Recommendations
The best dispatch decisions depend on context.
Factors may include:
- Truck location
- Driver hours
- Equipment type
- Customer requirements
- Market rates
- Traffic conditions
AI-powered platforms analyze these variables simultaneously and provide recommendations tailored to specific operational situations.
AI-Powered Analytics Capabilities
Predictive RPM Modeling
Traditional reporting explains what happened.
Predictive analytics estimates what may happen next.
Predictive RPM modeling helps carriers forecast:
- Revenue opportunities
- Market changes
- Lane performance
- Seasonal trends
This enables proactive planning rather than reactive decision-making.
Automated Margin Analysis
Margin analysis traditionally requires significant manual effort.
AI systems automatically evaluate:
- Revenue
- Operating expenses
- Route costs
- Customer profitability
The result is faster access to accurate financial insights.
AI-Based Load Recommendations
Not every load deserves attention.
AI can analyze thousands of freight opportunities and prioritize those most likely to generate strong profitability.
Recommendations may consider:
- RPM
- Deadhead impact
- Driver availability
- Equipment compatibility
- Historical performance
This reduces decision fatigue and improves load quality.
Predictive Demand Forecasting
Forecasting future freight demand helps carriers prepare for market changes.
AI analyzes:
- Historical freight volumes
- Seasonal patterns
- Economic activity
- Industry-specific trends
Forecasts support better staffing, equipment deployment, and growth planning.
Exception-Based Management
Most dispatch operations spend too much time reviewing normal situations.
Exception-based management highlights only the issues requiring attention.
Examples include:
- Sudden rate drops
- Delayed shipments
- Margin deterioration
- Driver performance concerns
This allows dispatchers to focus on high-impact decisions.
Real-Time Profitability Scoring
Modern analytics platforms can score loads before they are accepted.
These scores may consider:
- Expected RPM
- CPM
- Lane performance
- Customer history
- Deadhead impact
Dispatchers gain immediate visibility into profit potential.
Business Impact of AI Dispatch Analytics
Revenue Per Mile Optimization
Improving RPM remains one of the most important objectives in trucking.
AI analytics helps carriers:
- Identify stronger freight opportunities
- Improve rate negotiations
- Reduce empty miles
- Optimize lane selection
Even small RPM improvements can significantly increase annual profitability.
Empty Mile Reduction
Deadhead miles represent one of the largest hidden costs in transportation.
Analytics platforms identify:
- Inefficient routing patterns
- Missed backhaul opportunities
- Geographic imbalances
Reducing deadhead often delivers immediate financial benefits.
Improved Fleet Utilization
A truck generates value only when it moves revenue-generating freight.
Utilization analytics helps carriers maximize:
- Equipment productivity
- Driver productivity
- Asset performance
Higher utilization frequently translates into higher profitability.
Faster Load Evaluation and Booking
AI dramatically reduces the time required to evaluate opportunities.
Rather than manually reviewing every load, dispatchers receive prioritized recommendations.
This increases efficiency and improves booking speed.
Automated Broker and Credit Assessment
Broker relationships carry financial risk.
Analytics platforms can automatically evaluate:
- Creditworthiness
- Payment history
- Reliability metrics
- Performance trends
This reduces risk while supporting better freight decisions.
Better Carrier Retention
Carriers remain loyal when dispatch services consistently improve profitability.
Analytics helps dispatch teams demonstrate measurable value through:
- Revenue growth
- Cost reduction
- Utilization improvements
- Performance reporting
Data-backed results strengthen long-term relationships.
Measuring ROI From Dispatch Analytics Investments
Time Savings Per Dispatcher
One of the easiest ROI metrics to measure is time.
Analytics platforms reduce:
- Manual reporting
- Data collection
- Spreadsheet management
- Administrative tasks
The resulting productivity gains can be substantial.
Increased Revenue Opportunities
Faster decisions and stronger insights often lead to:
- Better freight selection
- Higher rates
- More efficient operations
These improvements directly affect revenue generation.
Reduced Operating Costs
Analytics helps identify unnecessary expenses across:
- Fuel
- Maintenance
- Routing
- Equipment utilization
Reducing costs has a direct impact on profitability.
Improved Decision Accuracy
Data-driven decisions generally outperform intuition alone.
Analytics reduces guesswork and supports consistent operational execution.
Long-Term Scalability Benefits
Manual processes become increasingly difficult as fleets grow.
Analytics platforms provide the visibility needed to scale operations without proportionally increasing administrative complexity.
Choosing the Right Dispatch Analytics Platform
Fleet Size Considerations
Different solutions serve different fleet sizes.
Owner-operators may require simple reporting and RPM tracking.
Larger fleets often need:
- Advanced dashboards
- Multi-user access
- Predictive analytics
- Enterprise integrations
Choosing a platform aligned with operational complexity is critical.
Integration Requirements
Analytics is only as effective as the data it receives.
Important integrations may include:
- TMS platforms
- ELD providers
- Fuel card systems
- Accounting software
- GPS tracking solutions
Strong integration capabilities improve data quality and reporting accuracy.
Reporting and Dashboard Capabilities
The best platforms make information easy to understand.
Look for:
- Custom dashboards
- Visual reporting
- Automated reports
- Drill-down capabilities
Decision-makers should access insights without requiring technical expertise.
Scalability and Growth Readiness
A platform should support future growth.
Businesses often outgrow basic reporting tools as operations expand.
Scalable solutions reduce the need for costly platform migrations.
Budget and ROI Expectations
Technology investments should generate measurable returns.
When evaluating costs, consider:
- Time savings
- Revenue improvements
- Cost reductions
- Operational efficiencies
ROI should drive purchasing decisions.
Ease of Adoption for Dispatch Teams
Even powerful software fails when adoption is poor.
Successful platforms prioritize:
- User-friendly interfaces
- Minimal training requirements
- Workflow compatibility
Ease of use significantly influences long-term success.
Common Mistakes When Tracking Trucking Profitability
Focusing Only on Revenue
Revenue alone can create a misleading picture.
High revenue does not automatically translate into strong profits.
Ignoring Deadhead Costs
Deadhead miles reduce profitability regardless of freight rates.
Carriers that fail to track deadhead accurately often overestimate performance.
Overlooking Lane-Level Performance
Fleet-wide averages can hide underperforming routes.
Lane-level analysis provides more meaningful operational insights.
Using Incomplete Data Sources
Incomplete data leads to incomplete conclusions.
Accurate analytics requires comprehensive operational visibility.
Tracking Too Many KPIs
Not every metric deserves equal attention.
Successful organizations focus on the indicators most closely tied to profitability.
Failing to Act on Analytics Insights
Data only creates value when action follows analysis.
Many companies invest in reporting but fail to implement operational improvements based on findings.
Building a Data-Driven Dispatch Strategy
Defining Profitability Goals
Every successful analytics initiative begins with clear objectives.
Without measurable goals, even the most advanced analytics platform becomes another reporting tool.
Common profitability goals include:
- Increasing Revenue Per Mile (RPM)
- Reducing Cost Per Mile (CPM)
- Lowering deadhead percentage
- Improving fleet utilization
- Increasing profit per truck
- Enhancing dispatcher productivity
The goal is not to track more data. The goal is to use data to achieve specific business outcomes.
For example, a carrier experiencing high fuel costs may prioritize route optimization and fuel-efficiency metrics. A growing fleet may focus on utilization and dispatcher performance.
Clearly defined goals create direction for every analytics decision.
Establishing KPI Benchmarks
KPIs become meaningful only when compared against benchmarks.
Benchmarking allows carriers to answer questions such as:
- Are we improving?
- How do we compare to competitors?
- Which dispatchers perform best?
- Which lanes consistently outperform expectations?
Important benchmark categories include:
- RPM targets
- CPM thresholds
- Deadhead limits
- Utilization percentages
- Dispatcher productivity goals
- Load acceptance targets
Benchmarking transforms isolated numbers into actionable insights.
Creating Performance Dashboards
Dashboards make data visible.
Instead of searching through multiple reports, decision-makers can monitor performance from a centralized view.
Effective dispatch dashboards typically include:
- RPM trends
- Fleet utilization metrics
- Deadhead percentages
- Active load performance
- Lane profitability reports
- Dispatcher productivity scores
- Revenue forecasting indicators
Well-designed dashboards support faster and more confident decision-making.
Reviewing Analytics Consistently
Analytics is not a one-time exercise.
Markets change.
Costs fluctuate.
Customer requirements evolve.
Successful carriers establish consistent review schedules such as:
- Daily operational reviews
- Weekly performance evaluations
- Monthly profitability assessments
- Quarterly strategic planning sessions
Regular analysis ensures opportunities and risks are identified before they become major problems.
Driving Continuous Improvement
The most profitable trucking companies treat analytics as an ongoing improvement process.
Each insight creates an opportunity to:
- Reduce costs
- Increase revenue
- Improve utilization
- Strengthen operational efficiency
Small improvements made consistently often produce substantial long-term financial gains.
Continuous improvement turns analytics from a reporting function into a competitive advantage.
The Future of AI Dispatch Analytics
Browser-First Freight Technology
The trucking industry is moving toward browser-based operations.
Dispatchers already spend much of their day using:
- Load boards
- Broker portals
- Carrier websites
- Transportation platforms
Rather than requiring additional software, modern AI solutions increasingly integrate directly into browser workflows.
This approach minimizes disruption while improving productivity.
Browser-first technology is expected to become a standard component of future dispatch operations.
AI-Assisted Dispatch Analysts
The role of the dispatcher continues to evolve.
Tomorrow’s dispatch professionals will rely heavily on AI-generated insights.
Instead of manually evaluating every opportunity, dispatch analysts will focus on:
- Strategic decision-making
- Customer relationships
- Exception management
- Performance optimization
Artificial intelligence will handle much of the repetitive analysis, allowing humans to concentrate on higher-value activities.
Predictive Analytics and Machine Learning
Predictive analytics represents one of the most significant advancements in transportation technology.
Machine learning models continuously analyze:
- Freight demand
- Rate trends
- Capacity fluctuations
- Customer behavior
- Historical performance
As these systems improve, carriers gain increasingly accurate forecasts that support proactive planning.
Predictive capabilities will become a major differentiator in freight operations.
Autonomous Decision Support
Fully autonomous dispatching remains unlikely in the near future.
However, autonomous decision support is already becoming reality.
AI systems can:
- Rank load opportunities
- Recommend pricing strategies
- Predict profitability outcomes
- Identify operational risks
Human dispatchers maintain control while benefiting from advanced decision support.
This hybrid model combines speed, accuracy, and experience.
Integrated Transportation Intelligence Platforms
The future of trucking analytics lies in consolidation.
Instead of operating separate systems for:
- Dispatching
- Accounting
- Tracking
- Fuel management
- Maintenance
- Reporting
Organizations increasingly seek integrated intelligence platforms.
These ecosystems provide a complete operational picture, enabling more informed decisions across the entire transportation business.
Integrated intelligence will likely define the next generation of dispatch technology.
Conclusion
Dispatch analytics tools have become essential for trucking companies that want to move beyond basic load management and focus on long-term profitability. By tracking critical metrics such as RPM, CPM, lane profitability, fleet utilization, and dispatcher performance, carriers gain the visibility needed to make smarter operational decisions. AI-powered analytics further enhances this capability by providing real-time insights, predictive recommendations, and faster decision support. As freight markets become more competitive and margins continue to tighten, data-driven dispatching is no longer a luxury—it is a necessity. Carriers that embrace dispatch analytics today will be better positioned to reduce costs, improve efficiency, maximize profits, and build a stronger, more resilient transportation operation.
FAQS
What is RPM in trucking?
RPM (Revenue Per Mile) measures how much revenue a trucking operation earns for every mile traveled. It is a key indicator of revenue efficiency and overall fleet performance.
How do dispatch analytics tools improve profitability?
Dispatch analytics tools improve profitability by identifying high-performing lanes, reducing deadhead miles, optimizing fleet utilization, and uncovering cost inefficiencies that impact margins.
What metrics should dispatchers track daily?
Dispatchers should monitor RPM, CPM, deadhead percentage, fleet utilization, load acceptance rate, lane profitability, and dispatcher productivity to maintain operational efficiency.
How can fleets reduce deadhead miles using analytics?
Analytics tools identify inefficient routes, empty repositioning patterns, and missed backhaul opportunities, helping carriers minimize non-revenue-generating miles.
What is the difference between RPM and CPM?
RPM measures revenue generated per mile, while CPM measures operating costs per mile. Comparing both metrics helps determine actual profitability.
Are dispatch analytics tools suitable for owner-operators?
Yes. Many dispatch analytics solutions are designed for owner-operators and small fleets, providing valuable insights into profitability, expenses, and load selection.
What features should I look for in a dispatch analytics platform?
Look for RPM and CPM tracking, lane profitability analysis, fleet utilization monitoring, real-time dashboards, automated reporting, predictive analytics, and integration capabilities.
Can AI improve dispatch decision-making?
Yes. AI helps analyze large amounts of transportation data, identify profitable opportunities, predict market trends, and provide recommendations that support faster and more informed dispatch decisions.